top of page
Writer's pictureCatalyst Training

The Mid-Range Part One: Thinking Big Picture: Experiences, Biases, and Efficiencies By Joseph Gill

Like everybody else, I’m pretty sick of talking about mid-range jumpers.


Here's the central, persistent question: “How much should mid-range shots be emphasized, in both practice and games?”


Asking this question usually results in a binary answer, depending on who is answering: Analytics says as little as possible, basketball purists say it’s an essential skill set to have. The analytics community cites the low raw efficiency numbers, while the purists argue that getting to the rim or generating an open three-pointer is not a realistic ask on a possession-by-possession basis. Both answers have merit, as I’ll cover over multiple arenas of the discussion in this article’s three parts.


Part One will unpack some of my personal experiences on the basketball floor, the biases I and others may have formed from being around the game, as well as the value of efficiency, and a brief argument for the merits of tracking services like Synergy.


Part Two will take a broader look at the reasonable expectations of efficiency by shot location, as well as the demands of the college basketball market, and will deal with addressing common, situational arguments made by advocates of the mid-range.


Part Three will include my personal criteria for successful mid-range shot selection, lessons from conversations with the skills trainer of an NBA All-Star who heavily (and efficiently) utilizes the mid-range shot, and the conclusions of the series.


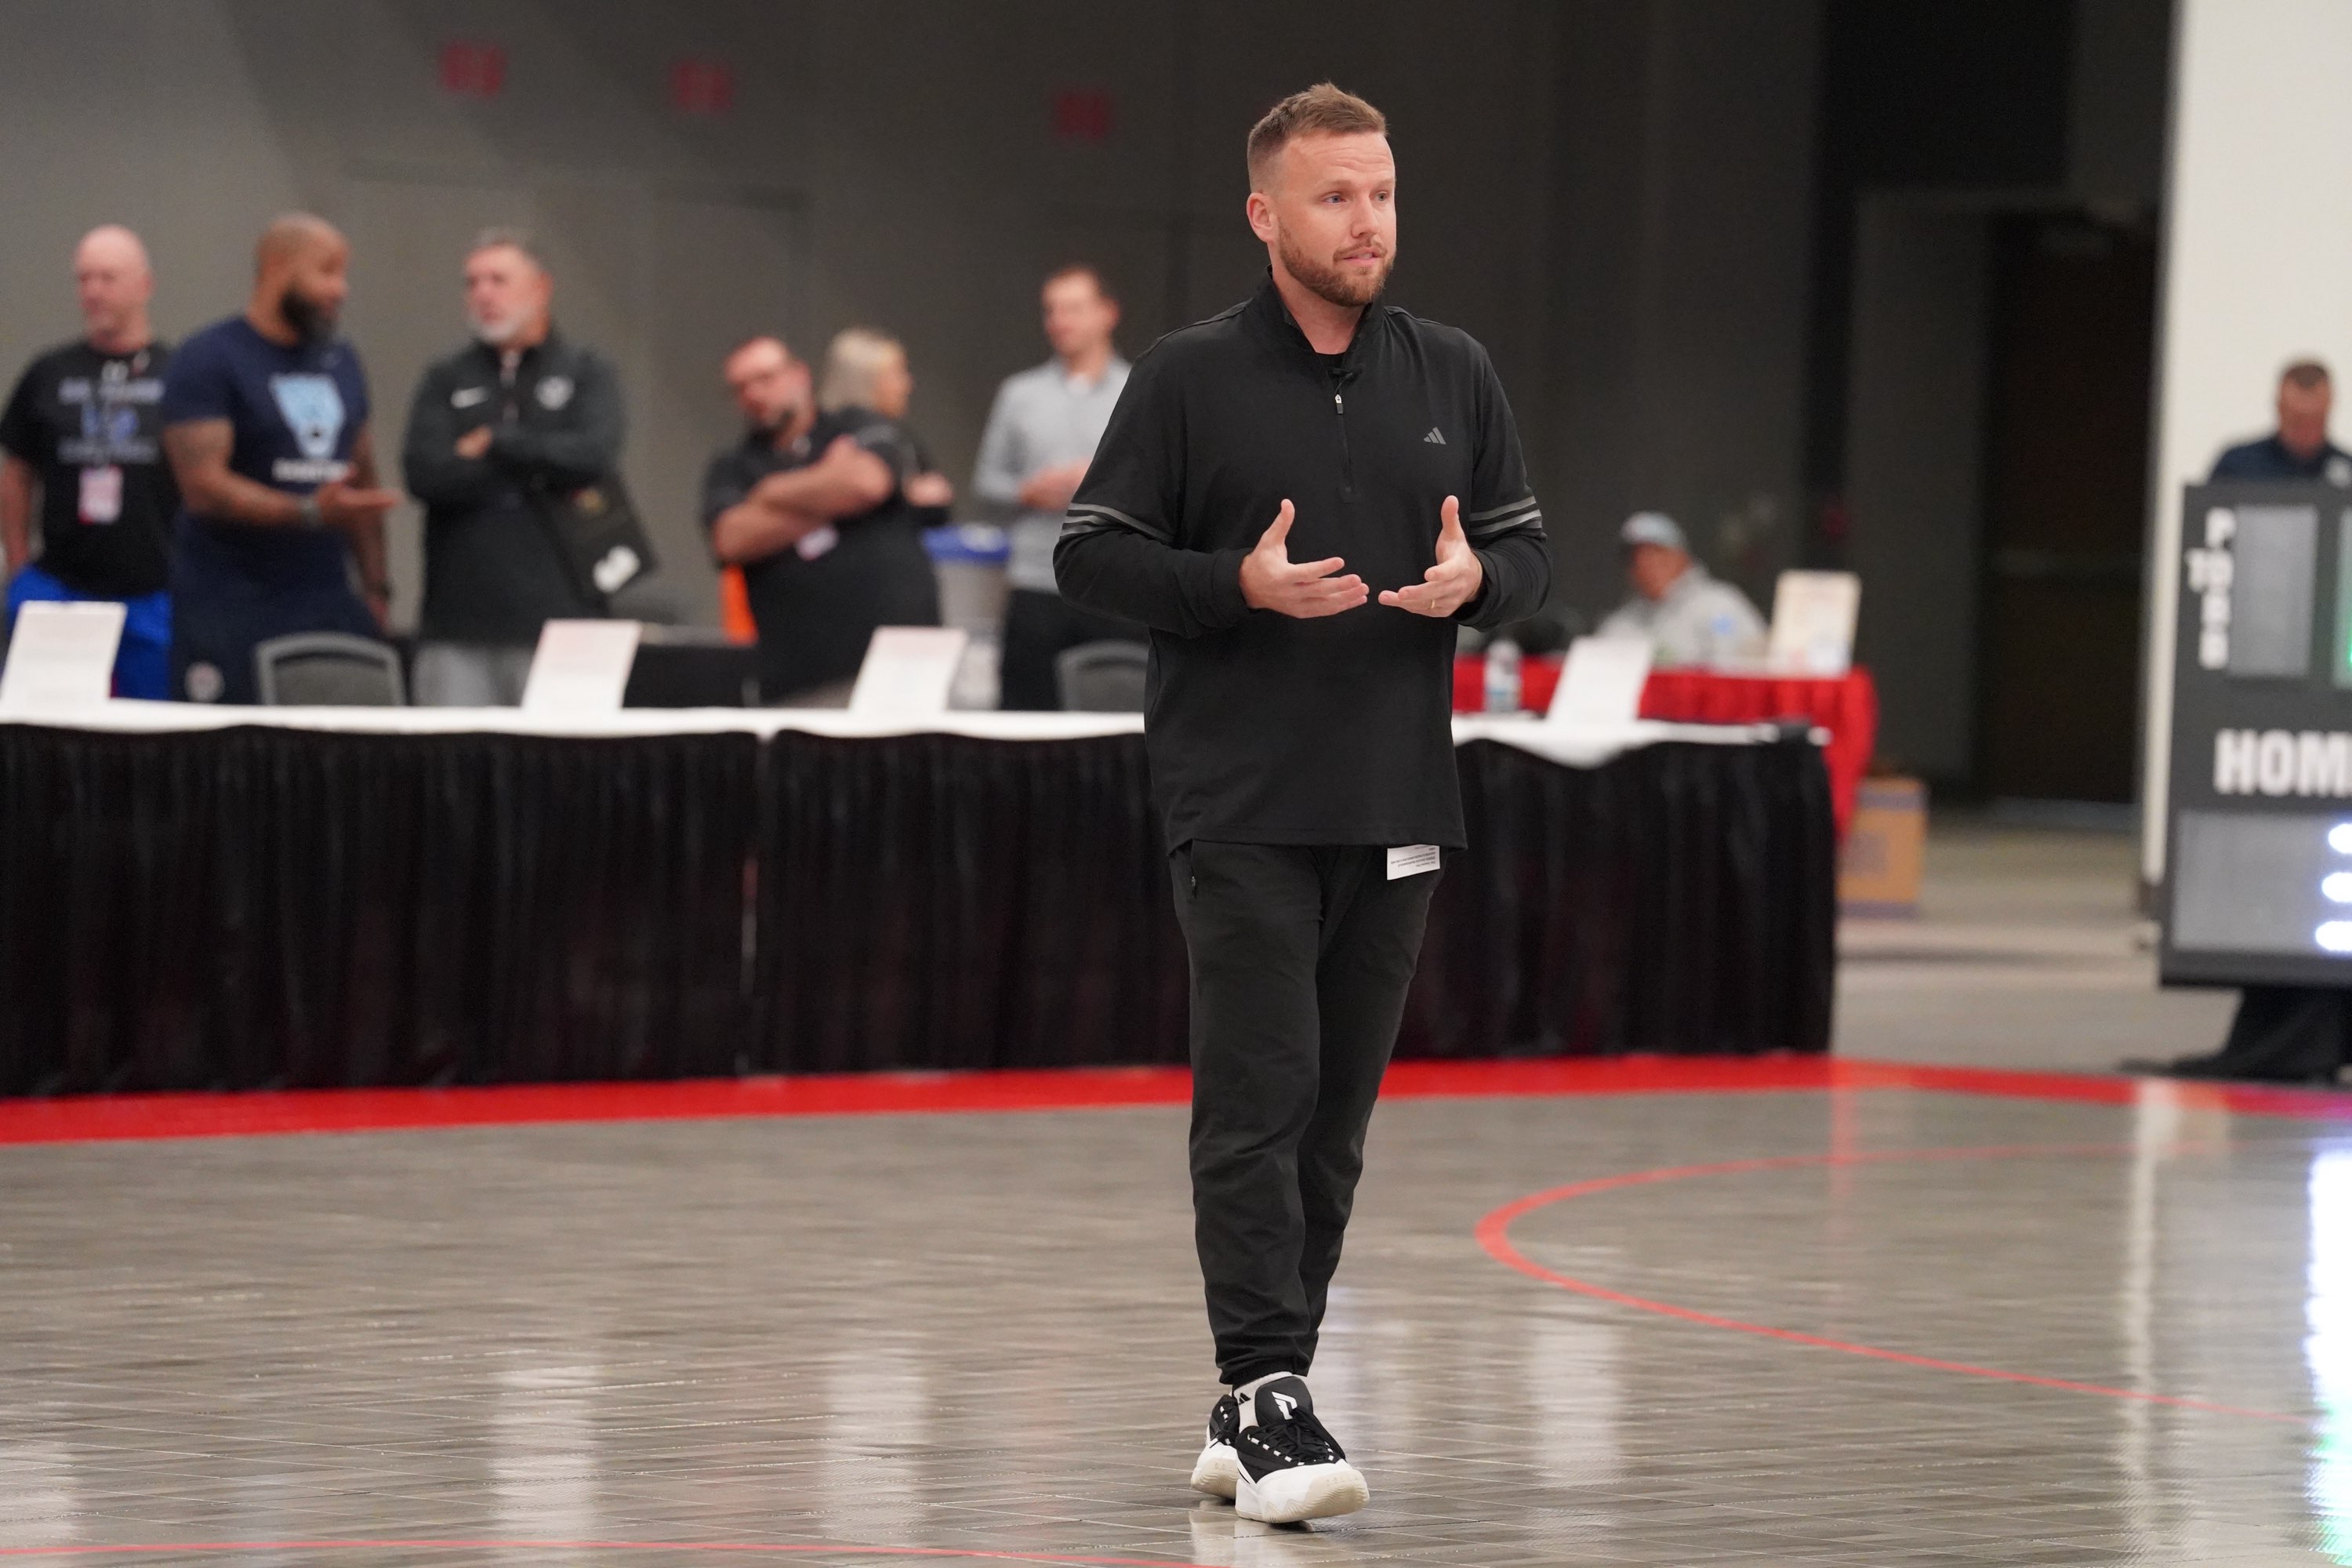
So, with that roadmap in mind, if we’re going to talk about the mid-range, we should start here: A made mid-range jumper is one of the most beautiful plays in basketball. I still love taking mid-ranges, just not at the same rate as during my college days when it comes to playing pick-up. At the Final Four last year with other analytics professionals Edwards Egros and Dan Dickey, I had to get a video of me taking one of the worst shots in basketball, the sharp-angle, step-back 19-footer, on the court at the NABC.

I know I’m not the only person who feels this way. Basketball has a love affair with the mid-range shot. People want to love it, and it’s easy to love when it goes in.


In college, there was a player on the team my freshman year who had a face-up jumper from the mid-post that seemed absolutely unstoppable. We called it “The Wolhowe,” for the player’s last name. Derek had incredible feet, and for this move he’d open up immediately on the catch, covering about three feet backwards, yet he always seemed to stay perfectly on balance as he left the ground, eyes glancing down to check his separation on lift-off, elbow perfectly tucked it as he rose above the space he had created from about 15 feet out. Derek shot exactly 60% from two over that season, 42 for 70. Back then, if I had to guess what he shot on The Wolhowe, I would’ve guessed 65 or 70%.


Knowing what I know now, it was probably closer to 55%, as explained in [this more detailed,, 500-word, Fermi estimate here]. Today, tracking the number of attempts would be easy due to Synergy, but this season wasn’t logged, so we don’t have that luxury. If you’re willing to simply take my word for it, the assumed field goal percentage on The Wolhowe is 56% (14 for 25). If not, feel free to check my full reasoning and process of estimation. The good news is this is the only estimation I have made, the rest of this article will deal exclusively with data that has been reliably tracked.


When writing this article, I texted the other three freshmen that were on the team with me that season, seeing what they remembered about The Wolhowe. It’s very illuminating how my teammates and I remembered this mid-range move.


We agreed on all the details I recalled in my explanation. One player simply texted back just, “THE THING,” another name for the shot. Another one texted back an entire paragraph on what he remembered about the move. A shot that was used exactly once a game, for the one season I was at Bethel University and was made roughly 55-60% of the time, was so memorable that I’m writing about it and reminiscing over text with my teammates many years later. It was potentially the single most memorable thing I watched a teammate consistently do on the court.


But if I had to rank Derek in the list of the best players I ever played with, I’m not sure if he would be in the top twenty. Number one? Isaiah Zierden, who I played three years with during high school. Isaiah shot 46% from three in his high school career, and in his 17u season in Nike EYBL, he led the EYBL circuit in three-pointers made and at a 48% clip, then headed off to play at Creighton. Do I have memories of Isaiah dominating high school competition? Absolutely. Is there any one, single signature move that sticks out in my mind as much as Derek’s face-up jumper? Not even close. The 30 or so points that Derek dumped in from the mid-range stands out as far more memorable than any of the batch of 1,670 that I watched Isaiah score. Derek’s shot was probably a 1.12 Points Per Play attempt, while Isaiah’s threes in high school were worth significantly higher at 1.38 PPP. Obviously I knew, even then, that Isaiah’s threes were far much deadly, but then why did it always feel like both shots were about as effective to me?


That’s the problem with biases, particular basketball biases. Everybody loves a great mid-range move. They make for great stories, but that might also actually be a problem when getting down to the business of trying to win basketball games.


For a recent example of biases that everybody reading this article should remember, we can turn to the 2019 NBA playoffs. Kawhi Leonard’s 2019 postseason run to the Finals will probably always be associated with a dominant display from the mid-range. But, the reality is Synergy tracked Leonard as 63 for 142 (44%) from mid-range in the half-court during that entire playoff run, for a PPP of 0.89. Factoring out these mid-range shots from Kawhi’s scoring profile means everything else Kawhi did in the half-court yielded a PPP of 1.12. In other words, Kawhi scored 26% more points on possessions when he didn’t take a mid-range shot versus the ones he did, turnovers included.


To put those efficiency numbers into a regular season, league-wide context, there were 207 players in the NBA with at least 500 total tracked plays (comprised of either a shot attempt, turnover, or foul that led to free throws) during the 2018-19 season. A player with a cumulative of 1.12 would’ve ranked 13th in PPP. A player with a 0.89 PPP would’ve ranked 180th.


But exactly how important is the stat I’ve started citing, Points Per Play? This might sound initially dramatic, but it’s the most meaningful stat in basketball that isn’t the raw scoring margin (or any derivative form), because of how strongly it relates directly to the raw scoring margin, as well as the potential for how actionable leveraging PPP can be to coaching staffs and players. In the 2018-19 NBA season, the team that won the Points Per Play battle, so before even taking into account the possessions-preserving nature of offensive rebounds for both teams, won the game 89% of the time. If a team won the Points Per Play margin by 0.05, the equivalent of scoring 1 more point every for every 20 shot attempts, free throw possessions, and/or turnovers, and that winning percentage jumped all the way to 97%.


While nothing exists in the basketball in a vacuum except for the final score, and some offensive archetypes of players have to work harder to be more efficient in PPP, the fact remains that a higher PPP is directly and massively correlated with winning more games. If there is a single metric to track when charting possessions during a game from the bench, it’s not field goal percentage, effective field goal percentage, or paint touches, it’s PPP.


That’s the statistical secret of the sport: Basketball is not a game of volume, but a game of efficiency masquerading as a game of volumes. For every possession your team has, the opposing team will always (with the exception being the end of quarters/halves) have the next possessions, and immediately. All shot attempts will yield an expected PPP above 0.00, even a heave from 90-feet away, so the fact that points can be observed as scored at times from a shot is meaningless in comparison to the rate that points are consistently scored from a shot. This is the reason why sometimes the most detrimental player on a team is the one who leads or is second on the team in scoring average, because his inefficiency and usage rate forces his teammates to pick up an impossible amount of slack in the remaining possessions to attempt to get the entire offense operating at an efficient rate. Basketball is not a game where all the players on a team get to combine their production independent of one another into the whole, team output, it’s a possession-by-possession tug of war where knowing your role is far more important than how hard you aspire to tug.


Going back to Kawhi’s postseason run, many of those 62 mid-range makes were timely, late in the shot clock, and/or memorable, especially the one that sent the Raptors to the Eastern Conference Finals over Joel Embiid in the right corner, but such is the nature of biases. Our minds subconsciously craft a narrative of events that reinforce our initial perception, and we edit out the parts that don’t fit after a while. We remember the remarkable, and forget the mundane, regardless of actual impact. While most people will recall that Fred VanVleet made 30 of 57 threes over the final 9 games of the run, that 1.58 PPP run from deep is often a footnote to Kawhi’s mid-range jumpers, despite being almost twice as efficient.


Now, is there a benefit to Kawhi being able to reliably attempt a mid-range on a given possession, while Fred VanVleet’s three-point attempts were largely dependent on his teammates creating an initial advantage? Absolutely, especially when considering that 25 of Fred’s 30 three-point makes were assisted. But, efficiency still looms larger than individual offensive autonomy.


All of this, the observation biases and the nonuniformity of situations on all conceivable levels, makes for a dangerous tightrope to walk in basketball analysis, and why tracking services such as Synergy and Second Spectrum have proven so valuable. Analytics services can track and organize the important, but small, details and outcomes of every possession of a game, and then reliably weigh everything to their proper amounts when supplying big picture analysis. Meanwhile, every time as humans that we use just our memory to recall a story that happened even a month or so ago, how often do we find that important details, including even the timeline of events, have already been scattered to the wind? To me, that is the main selling point of analytics, regardless of how advanced the knowledge needed to understand some of the more complex analytics analysis is. While those levels of statistical and technical know-how might intimidate the average coach or player, it only obscures those coaches’ and players’ ability to identify simple, yet actionable and impactful, relationships on their own. In a sport where at 0.05 Points Per Play differential or greater, the equivalent of shooting 2.5% from two, over the opponent supplies a 97% win rate, how can any team afford to simply punt on tracking all details to the fullest available extent (if these services are available at the level this team plays at)?


To go back one last time to Kawhi’s mid-range performance in the 2018-19 playoffs, let’s run a simple thought experiment on those 142 attempts that yielded a 0.89 PPP return.


Let’s imagine that Kawhi never took a single one of those 142 mind-range shots, and just 25% of those possessions instead were turned into catch-and-shoot three-pointers that were made at a 40% rate (a percentage not outside the realm of probability, the Raptors shot 44% on unguarded catch-and-shoot attempts as a team during that season), what would the PPP return on the remaining 75% of possession need to be to break-even compared to the shots that Kawhi took?


The answer is shockingly low: The breakeven point of those remaining 106 possessions would only need to be 0.78 PPP, a number just below the league-wide, playoff average for possessions tracked as occurring in the final 4 seconds of the shot clock at 0.79 PPP.


There’s a lot of ways this thought exercise could’ve been more nuanced, and I’m not going to openly question the decision-making of the reigning NBA Finals MVP, but the process can be applied to every single inflection point of a basketball game. With analytics, we can track what has happened and at what rate, and if that action didn’t occur at that point, a wildly favorable outcome would’ve surely occurred at some rate as well. If we know that rate and how favorable an outcome it was, we can work backward to see just how dire the situation would’ve had to be to make the actual course of action appear either reasonable and prudent, or potentially a little too quick-triggered in taking a tough shot. The thought process can be outlined in a simple table, like this:

Is this a reasonably likely hypothetical situation that I’ve contrived? I think it’s within the realm of possibility, especially considering Kawhi only had 86 two-point attempts occurring in the final 7 seconds of the shot clock during this playoff run, so at a minimum 56 of his mid-range attempts came with a considerable amount of time remaining on the shot clock. I also would understand the argument that perhaps I have overestimated how often a 40% catch-and-shoot three-pointer can be created, as an unguarded catch-and-shoot possession was only generated on 14% of half-court possessions in the 2018-19 playoffs, league-wide (Toronto, however, generated them at a 19% rate, though obviously the chance of generating one of these looks decreases as the shot clock does).


But, whether or not I’ve created a reasonable example for this situation should take the backseat to the idea that it’s not super difficult to create one of these binary-state, hypothetical calculations, and they can be used for as jumping-off point for a more serious and nuanced discussion.


To tie this first installment together, it might seem like a strange way to start a series on the mid-range jumper, with a series of basketball anecdotes with a supporting narrative of statistical analysis interwoven behind them, but this is exactly how we all experience basketball. Nobody is tracking shot selection in real-time to such percentage-perfect marks. We watch, we enjoy (or, recoil), then we make big-picture assessments, often in the form of a narrative, at a later time. I’m not advocating for a Big Brother-style analytical state, where every single aspect of a possession is analyzed and then deliberated amongst decision-makers in what is basically real-time. But, to have a basketball discussion, it’s important to be mindful that our histories affect our perception of the game, and the important gap between event and discussion invites in all sorts of biases that can compound over time.


And biases are, inherently, non-optimal.


In a game where at least a 0.05 Points Per Play advantage over the opponent all but ensures victory, if you’re not as obsessed with being optimal as the opposition, you’re willfully putting your players in a hole before the opening tip has even occurred.

691 views
bottom of page